Below you will find sources for data, and data visualization.
Not finding what you need? ResearchDataGov is a web portal for discovering and requesting access to restricted microdata from federal statistical agencies.
- Agriculture
-
Census of Agriculture
The Census of Agriculture is a complete count of U.S. farms and ranches and the people who operate them. Even small plots of land - whether rural or urban - growing fruit, vegetables or some food animals count if $1,000 or more of such products were raised and sold, or normally would have been sold, during the Census year. The Census of Agriculture, taken only once every five years, looks at land use and ownership, operator characteristics, production practices, income and expenditures.Quick Stats Lite provides a more structured approach to get commonly requested statistics from our online database. The Quick Stats Database is the most comprehensive tool for accessing agricultural data published by National Agricultural Statistic Services. It allows you to customize your query by commodity, location, or time period. You can then visualize the data on a map, manipulate and export the results, or save a link for future use.
Access Census Data Query Tool
The Census Data Query Tool (CDQT) is a web based tool that is available to access and download table level data from the Census of Agriculture Volume 1 publication.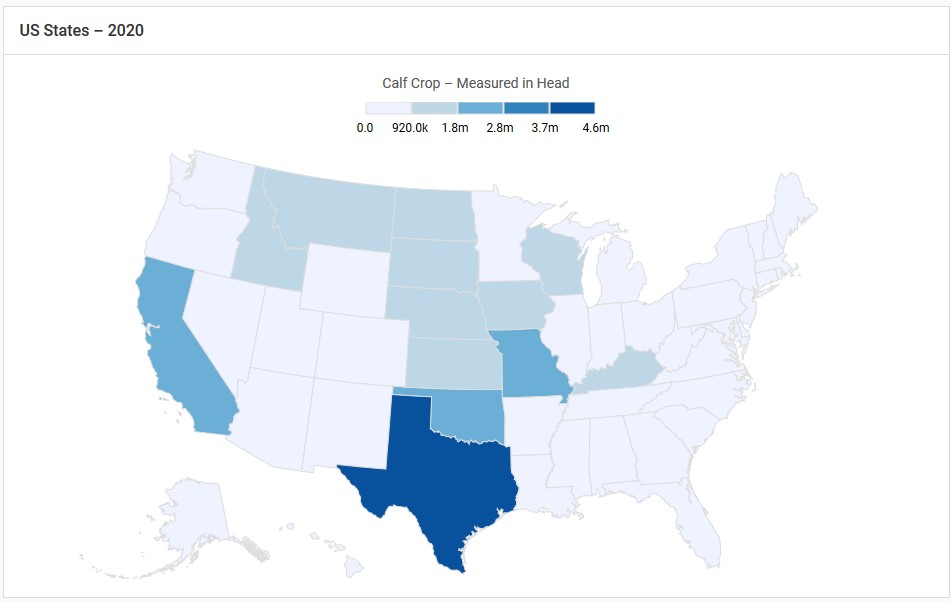
Interactive data visualizations. Other resources include:
- CropScape
- Cropland Data Layer
- VegScape Crop-CASMA
- Crop Progress & Condition Gridded Layers
- Disaster Analysis
- Land Use Strata for Selected States
International
Food and Agriculture Organization of the United Nations
The Food and Agriculture Organization (FAO) is a specialized agency of the United Nations that leads international efforts to defeat hunger. FAO is responsible for the worldwide collection, validation and dissemination of data and information related to food and agriculture. As such, FAO collects relevant national statistical information on a regular basis. The information collected can be accessed via: - Business
-
CBP is an annual series that provides subnational economic data by industry. This series includes the number of establishments, employment during the week of March 12, first quarter payroll, and annual payroll.
Data Visualizations (2015-2021)
State Facts for StudentsJ2J Explorer
Job-to-Job Flows Explorer is a web-based analysis tool that enables comprehensive access to an innovative new set of statistics on worker reallocation in the United States.OnTheMap
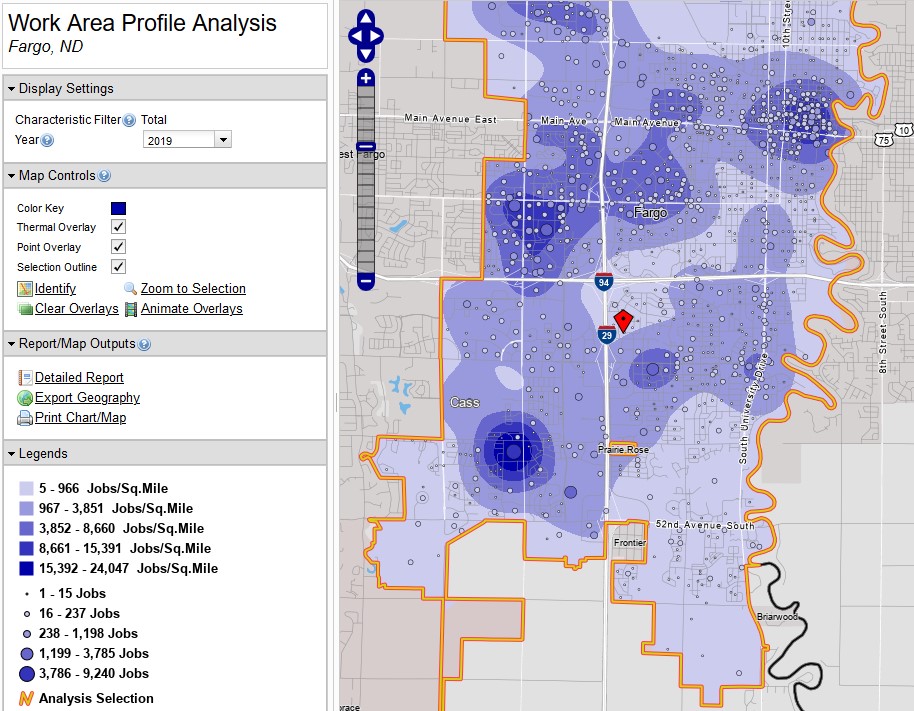
OnTheMap is a web-based mapping and reporting application that shows where workers are employed and where they live. It also provides companion reports on age, earnings, industry distributions, race, ethnicity, educational attainment, and sex.Longitudinal Employer-Household Dynamics
The Longitudinal Employer-Household Dynamics (LEHD) program is part of the Center for Economic Studies at the U.S. Census Bureau. The LEHD program produces new, cost effective, public-use information combining federal, state and Census Bureau data on employers and employees under the Local Employment Dynamics (LED) Partnership.
Outdoor Recreation statistics (BEA)
Measures the economic activity as well as the sales or receipts generated by outdoor recreational activities, such as fishing and RVing.U.S. Opportunity Zones
The Opportunity Zones initiative is not a top-down government program from Washington but an incentive to spur private and public investment in America’s underserved communities.
Map of Opportunity Zones (HUD)
Opportunity Zone maps (Community Development Financial Institutions Fund)
North Dakota Opportunity Zones - Census Geography Program
-
Cartographic Boundary Files
The cartographic boundary files are simplified representations of selected geographic areas from the Census Bureau’s MAF/TIGER geographic database. These boundary files are specifically designed for small scale thematic mapping.The Digital Equity Act Population Viewer helps you understand who has internet access, devices, and digital skills – and who doesn’t. This interactive map shows broadband availability and use alongside demographics in every state.
Interactive Maps
Includes Census Business Builder, the Map on Emergency Management, the Data Visualization Gallery and more.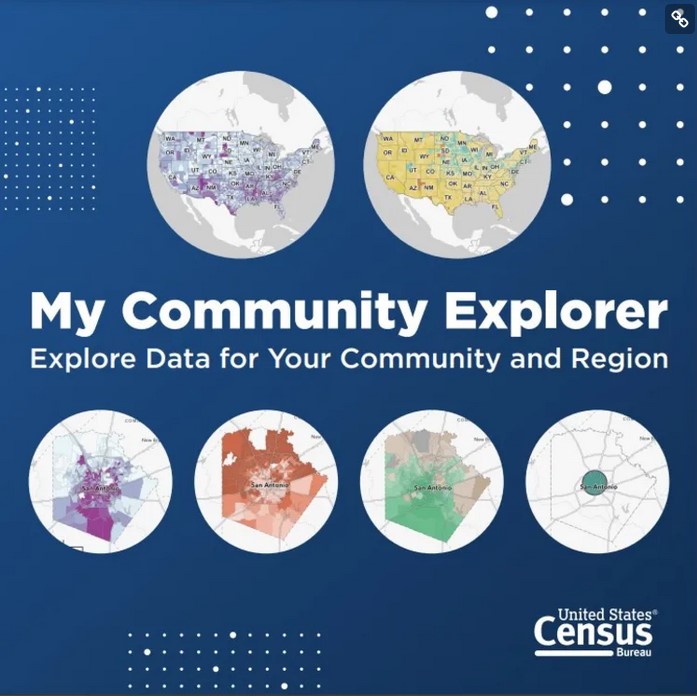
My Community Explorer combines select demographic, business, and resilience data to help you identify potentially underserved areas of your state, county, and community and inform data-based solutions.
TIGER/Line Shapefiles (2000-present)
The core TIGER/Line Files and Shapefiles do not include demographic data, but they do contain geographic entity codes (GEOIDs) that can be linked to the Census Bureau’s demographic data, available on data.census.gov.TIGER/Line Geodata (2013-present)
The geodatabases contain national coverage (for geographic boundaries or features) or state coverage (boundaries within state).U.S. Census Geography Program
Geography is central to the work of the Census Bureau, providing the framework for survey design, sample selection, data collection, tabulation, and dissemination. Geography provides meaning and context to statistical data.Tutorials:
- COVID-19 Data
-
National
North Dakota
North Dakota State Synopsis 8/6/2021
The statistics for campus were removed but can still be accessed by the Wayback Machine up to July, 2022.
Minnesota
Coronavirus Disease- situation update
International
World Health Organization - Coronavirus disease (COVID-19) pandemic
- Crime and Legal Data
-
Uniform Crime Reporting
The Uniform Crime Reporting (UCR) Program generates reliable statistics for use in law enforcement. It also provides information for students of criminal justice, researchers, the media, and the public. The program has been providing crime statistics since 1930.Crime Data Explorer
Use the CDE to discover available data through visualizations, download data in .csv , and other large data files.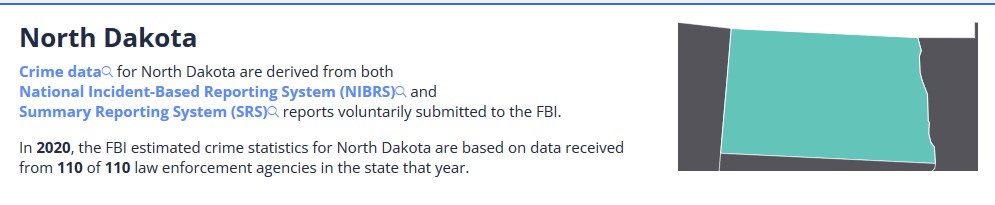
Department of Justice Data
The Department of Justice provides statistics on a wide variety of subjects.Bureau of Alcohol, Tobacco, Firearms and Explosives Data and Statistics
This comprehensive collection of ATF-related data from national surveys, state-based surveys, other collected license statistics, and other data sources documents trends in firearms, commerce and use of federal services in the United States.Infographics - ATF by the Numbers, Bomb Threats Across the U.S., Types of Federal Firearms Licenses, and more.
National Violent Death Reporting System (NVDRS)
In the United States, more than seven people per hour die a violent death. In 2019, more than 19,100 people were victims of homicide and over 47,500 people died by suicide.
- Education
-
Scientists and Engineers Statistical Data System
SESTAT is the Scientists and Engineers Statistical Data System. This integrated data system is a unique source of longitudinal information on the education and employment of the college-educated U.S. science and engineering workforce. These data are collected through biennial surveys:The National Survey of College Graduates (NSCG)
The National Survey of Recent College Graduates (NSRCG)
(discontinued after 2010) The Survey of Doctorate Recipients (SDR)DataLab –NCES
The National Center for Education Statistics (NCES) is the primary federal entity for collecting and analyzing data related to education in the U.S. and other nations. Online table and regression maker tools featuring 30+ federal education datasets. Contains three powerful tools for your analytical needs: QuickStats – Allows novice users to create simple tables and charts; PowerStats – Allows researchers to create complex tables and logistic and linear regressions; and TrendStats – Allows researchers to create complex tables spanning multiple data collection years. Also, contains the Tables Library which houses 5000+ published analysis tables by topic, publication, and source.International Data Explorer
The International Data Explorer (IDE) is an interactive online tool with data from international assessments and surveys, such as PISA and TIMSS. Use the IDE to explore student and adult performance on assessments and survey results for thousands of variables for the U.S. and other countries. - Elections & Voting
-
The American Presidency Project
Voting statistics for presidential elections 1989-2020Voting and Registration (Data for 1960-Present)
For every national election since 1964, we collected data on the characteristics of American voters. Find out how many citizens of voting age are registered, and how many vote, by age and sex, race and ethnicity, and more.North Dakota Election Results
- Environment
-
The MyEnvironment search application is designed to provide a cross-section of environmental information based on the user's location.
Outdoor Recreation statistics (BEA)
Measures the economic activity as well as the sales or receipts generated by outdoor recreational activities, such as fishing and RVing.North Dakota Data and Maps
The Department of Environmental Quality (DEQ) has made many records available on-line for self-serve.Land
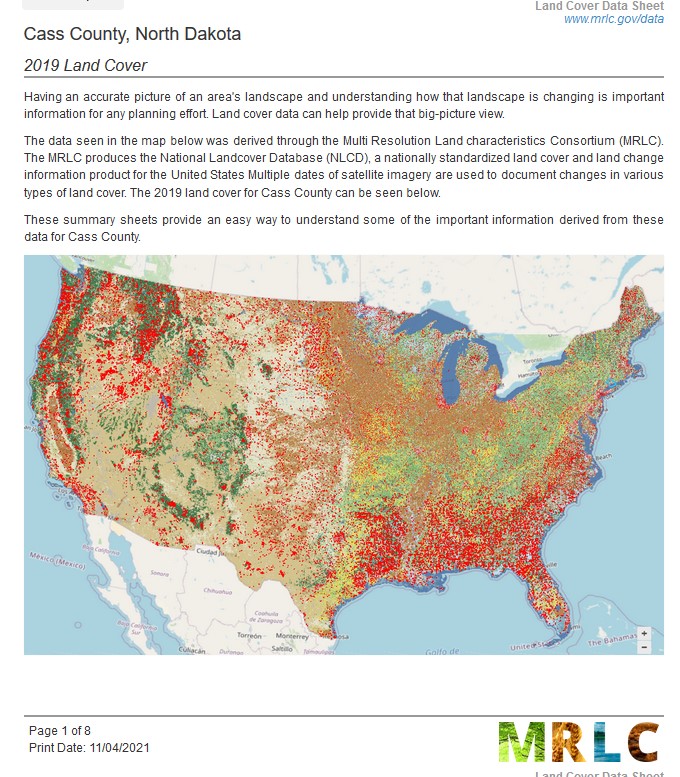
Land Cover (USGS)
The National Land Cover Database (NLCD) provides spatial reference and descriptive data for characteristics of the land surface such as thematic class (for example, urban, agriculture, and forest), percent impervious surface, and percent tree canopy cover. NLCD products are created by the Multi-Resolution Land Characteristics (MRLC) Consortium, a partnership of Federal agencies led by the U.S. Geological Survey.
MLRC EVA mapping tool
EnviroAtlas, Learn more (about and tutorials)
This easy to use, interactive mapping application does not require any GIS skills to use and provides ready access to 500+ maps and multiple analysis tools.
Air
National Air Toxics Assessment (2014, EPA)
The 2014 NATA Map application lets you display risks, emissions, and other NATA data on a map. You can also download all NATA data and results, and run queries to find just the information you want.
Water
Water Data Visualizations (USGS)
USGS data science and visualization experts use visualizations to communicate water data in compelling and often interactive ways when static images or written narrative can’t effectively communicate the interconnectivity and complexity of a water data issue.
- Health
-
Specific conditions
Explore vital health factors such as access to health care, obesity, smoking, excessive drinking and others in nearly every county in United States. The presented data comes from the County Health Rankings & Roadmaps program (2010 - 2016).
- Data & Statistics | Overweight & Obesity
- CDC - Data and Statistics - Sleep and Sleep Disorders
- CDC - Online Tools - Alcohol
- State Tobacco Activities Tracking & Evaluation system
State and national level data for multiple conditions
The Chronic Disease Indicators (CDI)
A comprehensive set of more than 100 national and state public health measures that were developed to improve the quality and availability of surveillance data on chronic diseases and health risk behaviors, and support the development of effective prevention strategies. - Agency for Healthcare Research and Quality- Data Visualizations
Content drawn from AHRQ’s data resources address various topics, such as COVID-19 hospitalizations, health insurance coverage, and emergency department visits. Users may customize visualizations according to geographic location, age, income, and other categories. AHRQ also offers data infographics to showcase its research findings.
National Center for Health Statistics -Data Visualization Gallery
U.S. Cancer Data:
Use the Data Visualizations Tool to explore U.S. Cancer Statistics.
NCI Cancer Atlas allows users to create maps of cancer statistics, demographics, and risk factors.
The joint NCI-CDC State Cancer Profiles website provides interactive maps to visualize cancer statistics by states and counties.
- People
-
Census data for many subjects is available and downloadable. Different tools are available for mapping and visualization.
American Housing Survey (AHS)
The AHS Table Creator gives you the ability to create customized tables from the American Housing Survey without having to use the Public Use File (microdata).Census microdata can be used to build your own tables, combining various topics for customizable tables.
IPUMS Abacus provides a mobile-friendly interface for quickly generating cross tabulations of IPUMS USA data. Select up to two variables from up to two time periods and cross-tabulated Census/ACS data will be at your fingertips.
IPUMS USA collects, preserves and harmonizes U.S. census microdata and provides easy access to this data with enhanced documentation. Data includes decennial censuses from 1790 to 2010 and American Community Surveys (ACS) from 2000 to the present.
- Government Spending
-
USA Spending.gov
USAspending.gov links data from many government systems, including agency financial systems and government wide award systems.Historical Tables
Office of Management and Budget - North Dakota
-
North Dakota Compass
North Dakota Compass is a social indicators project that measures progress in our state, its eight regions, 53 counties, four Native American reservations, and larger cities (see map). Compass tracks trends in topic areas such as children and youth, economy, health, housing, and workforce (with more currently being developed). It inspires people to take action to improve our economic vitality and quality of life.